
The Nasdaq Composite is one of the world’s most watched stock indices, especially among tech investors. It serves as a barometer of innovation, growth, and speculative fervor. But beyond headlines, it’s also a useful tool for understanding broader market cycles, sector rotations, and investment strategies. In this article, we will:
- Explain what exactly the Nasdaq Composite is and how it’s calculated
- Trace its historical evolution and major milestones
- Examine recent performance, drivers, and risks
- Discuss how investors can use the index in strategy, benchmarking, or passive exposure
- Share lessons and outlook for the Nasdaq Composite going forward
If you publish this on your blog, it can attract readers searching for “Nasdaq index history,” “Nasdaq Composite performance,” “how to invest in Nasdaq,” etc.
1. What is the Nasdaq Composite?
Definition & composition
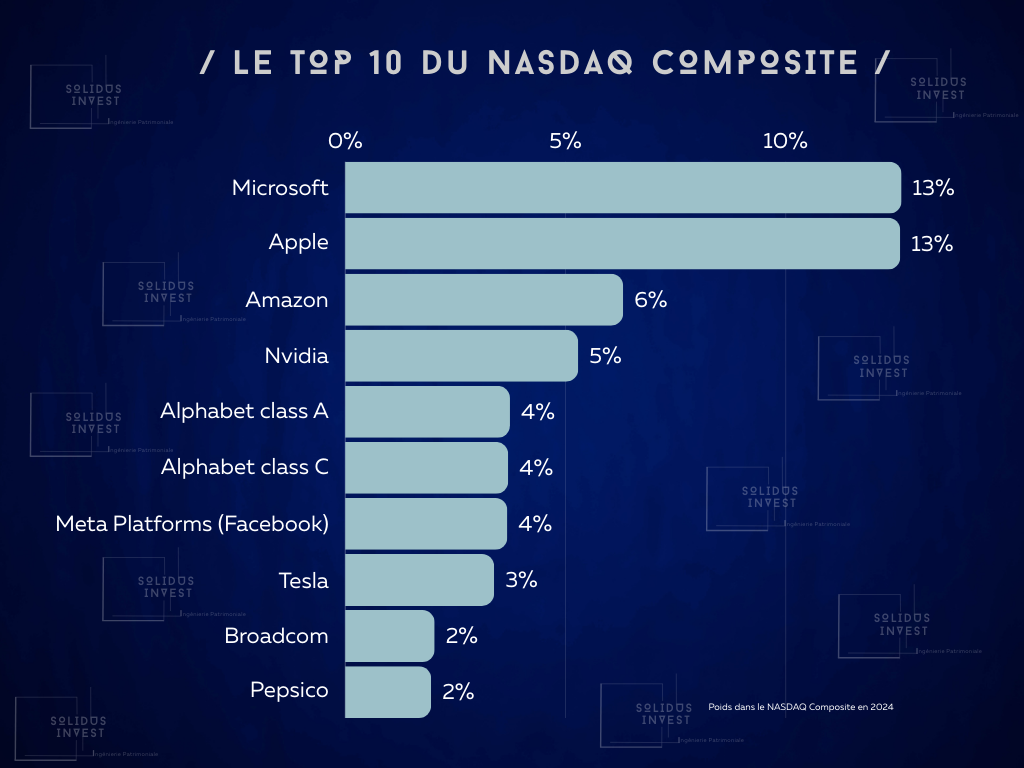
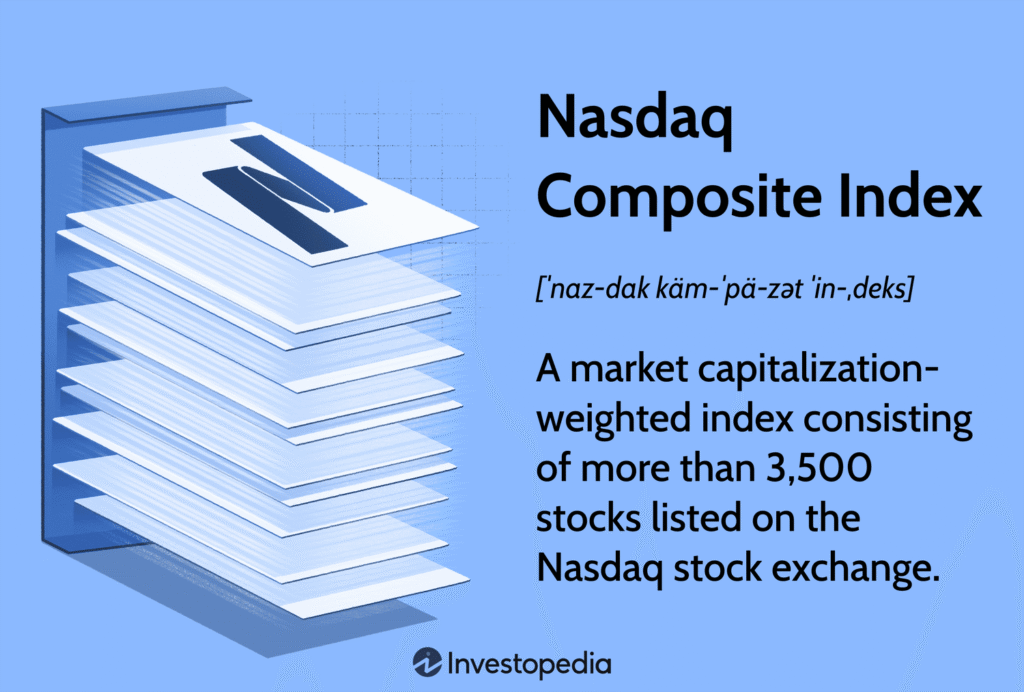
The Nasdaq Composite (ticker symbol ^IXIC) is a market-capitalization weighted index that includes most stocks listed on the Nasdaq stock exchange — excluding derivatives, preferred shares, ETFs, and funds.
Because of this, the index contains thousands of equities across multiple sectors (though heavily tilted toward technology, biotech, and growth companies).
It is distinct from the Nasdaq-100, which includes only 100 of the largest nonfinancial companies listed on Nasdaq. The Nasdaq-100 often drives much of the headline moves in the Nasdaq Composite, but the broader Composite includes many smaller, more speculative names as well.
Calculation & weighting
Because it is market-cap weighted, companies with higher market capitalization (i.e. share price × shares outstanding) carry more weight. This means that a few mega-capitalization companies (especially in tech) can significantly influence the index’s movement.
The index is normalized via a divisor so that changes in share capital, stock splits, or new listings/delistings do not artificially distort movements.
Thus, a 1% move in a large-cap tech stock may move the index more than a 5% move in a much smaller company, depending on weight.
Key advantages & limitations
Advantages:
- Broad exposure to Nasdaq-listed equities
- Reflects tech and growth sector momentum
- Useful benchmark for growth-oriented funds
Limitations:
- High concentration risk (top names dominate)
- Volatility is higher than broader indices (e.g. S&P 500)
- Smaller, illiquid names may introduce noise
2. Historical evolution & major milestones
To understand where Nasdaq is today, it helps to look back.
Early decades & foundation
The Nasdaq Composite was launched on February 5, 1971, with a base value of 100.
Throughout the 1970s and 1980s, it gradually gained relevance, but its profile was modest compared to older indices like the Dow or S&P.
One interesting event: on August 22, 2013, Nasdaq experienced a “flash freeze” — trading was halted for ~3 hours due to an overload in systems, causing temporary price stasis.
Dot-com bubble & crash (late 1990s – early 2000s)
Starting in the mid-1990s, the Nasdaq Composite ballooned as tech and internet stocks surged. From 1995 to 2000, the index rose ~400%.
In March 2000, the index peaked at about 5,132.52 (intraday) and closed around 5,048.62.
But by October 2002, after the dot-com bubble burst, it had fallen ~78%, bottoming around 1,108.49 intraday.
This crash taught many investors about the dangers of speculative bubbles, valuation excesses, and concentration risk.
Recovery & expansion (2003–2007)
Following the dot-com collapse, the Nasdaq Composite recovered gradually, reaching above 2,800 in 2007 before the global financial crisis.
Financial crisis & rebound (2008–2015)
In 2008, the crisis dragged the index down sharply. By 2009, it hit lows around 1,268.64.
But from 2009 onward, as technology, mobile, cloud, and later AI, gained traction, the index rebounded strongly. Over the next decade, it would eventually reclaim and surpass previous highs.
Recent years: breaking 20,000 and current dynamics
A milestone: in December 2024, the Nasdaq Composite crossed 20,000 for the first time.
Its performance in recent years has been heavily driven by mega-cap tech names, AI enthusiasm, and expectations around interest rates.
As of 10 October 2025, the Nasdaq Composite closed around 22,204.43.
Thus, from its base of 100 in 1971 to over 22,000 in 2025, the Nasdaq has returned ~220× (ignoring dividends). Keep in mind, this includes many constituent changes, splits, and new listings over the decades.
3. Recent performance, drivers & risks
To understand what’s driving the Nasdaq now, and what could derail it, let’s examine key elements.
Key performance drivers
1. Mega-cap tech dominance
A few large tech names (e.g. Apple, Microsoft, Nvidia, Amazon, Alphabet, Meta) exert outsized influence on the index. Their movements often pull the index up or down.
2. Innovation & sector trends
Emerging themes — artificial intelligence, cloud, semiconductors, biotech, 5G/6G, fintech — tend to get priced into the Nasdaq early. Investors often allocate ahead of adoption curves.
3. Interest rates & monetary policy
Growth stocks are more sensitive to interest rates (because their value depends heavily on future cash flows). When rates are low or expected to fall, growth names rally; when rates rise, they suffer more.
4. Earnings & valuation multiples
Much of Nasdaq’s ascent is tied to lofty multiples (P/E, forward P/E). Thus, any disappointment in earnings or contraction in multiples can lead to sharp reversals.
5. Market sentiment & momentum
Momentum, sentiment amplifiers, retail flows (especially in “hot” tech names), and algorithmic trading often accelerate moves.
Risks & headwinds
- Valuation risk: In prior bubbles, valuations became disconnected from fundamentals (e.g. dot-com era). History warns of mean reversion.
- Concentration risk: The dominance of a few names means that if one or more of them stumble, the index may drop disproportionately.
- Regulation & policy: Tech companies face regulatory scrutiny (e.g., antitrust, data privacy, censorship, AI governance).
- Macro shocks & interest rate hikes: Unexpected Fed actions, inflation spikes, geopolitical risk can destabilize sentiment.
- Liquidity & speculation: Smaller names may become illiquid or manipulated in volatile times.
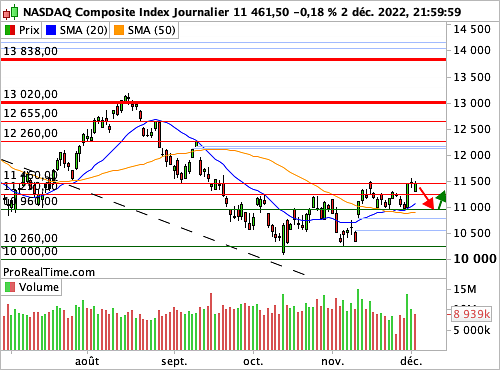
Recent technical observations
As of October 2025, the Nasdaq Composite has held above its 50-day moving average for more than 100 consecutive trading days — indicating persistent bullish momentum.
It is also breaking into fresh all-time highs territory, suggesting that buyers remain confident. Still, such long momentum streaks often invite periods of consolidation or pullbacks.
4. How investors use the Nasdaq Composite
The Nasdaq Composite is not just a benchmark — it’s also a tool and vehicle for strategy.
Benchmarking & performance measurement
Many growth or tech-oriented funds measure performance against Nasdaq Composite, or alongside S&P 500, Nasdaq-100, etc. Use it to assess whether a fund is truly “tech-weighted” vs broader market.
Passive exposure via ETFs & index funds
While you cannot invest directly in the Composite index itself, many ETFs and index funds approximate exposure to Nasdaq Composite (or its close proxies). For example, funds may replicate the Nasdaq-100 or a Nasdaq Composite-like basket.
Investors should check fees, tracking error, and liquidity when choosing such funds.
Tactical & rotational strategies
Some investors rotate between Nasdaq-heavy sectors and more defensive parts of the market depending on cycles (e.g. moving out of growth into value, or vice versa).
Also, using derivatives (options, futures) tied to Nasdaq indices is common for hedging or leveraged bets.
Risk management & drawdowns
Because Nasdaq tends to have sharper drawdowns in corrections, risk controls are important: stop losses, portfolio diversification (balance with value, dividends, bonds), position size limits.
Incorporating into forecasts & forward returns
Historical analysis suggests that after long runs, forward returns may moderate. Some tactical investors look at valuation multiples, growth expectations, and macro cues to time entry or trimming.
5. Lessons & outlook: what to watch next
Lessons from history
- Don’t confuse momentum with fundamentals
The dot-com bubble is a cautionary tale. High momentum can mask underlying weakness. - Concentration magnifies risk
While mega-cap names can drive returns, they also bring vulnerability if they falter. - Valuation discipline matters
Even growth names need to justify expectations; unsustainable multiples can reverse quickly. - Diversification softens volatility
Having exposure to non-tech, dividends, value, and defensive sectors helps navigate corrections. - Macro & policy shifts matter a lot
Because tech/growth stocks are interest-rate sensitive, central bank actions are critical variables.
What to watch going forward
- Interest rate trajectory and inflation data
Any aggressive rate hikes or inflation surprises could rattle growth stocks. - Earnings from mega-cap techs
If these names miss consensus, sentiment may turn. - Regulatory developments
Data laws, AI oversight, antitrust prosecutions may affect valuations. - New sector innovation
AI, quantum computing, biotech, space, fintech — the next breakthrough sectors could be catalysts. - Sentiment & momentum cycles
After long bullish runs, periods of consolidation or rotation are natural.
Possible scenarios
- Bull continuation: If rates moderate, earnings are strong, and innovation continues, Nasdaq may rise further, though perhaps at more moderate pace.
- Sideways/consolidation: The index may trade in a range as it digests recent gains, with pullbacks into support zones.
- Correction / reset: If macro shocks or overvaluation pressures hit, a drawdown of 10-20% or more is possible, especially from overbought levels.